Imagine walking into a banquet hall where the seating arrangement decides the importance of guests. If one seat is occupied by a celebrity billionaire, suddenly the average “wealth” of the room skyrockets, even though most guests are ordinary professionals. This is the story of the mean: easily swayed, often misleading. The median, however, acts like a fair host, positioning itself in the middle and ignoring extreme outliers. In data analysis, this quality makes the median a powerful ally, especially in skewed datasets where balance matters more than glamour.
Understanding Skewness: The Tilt in the Story
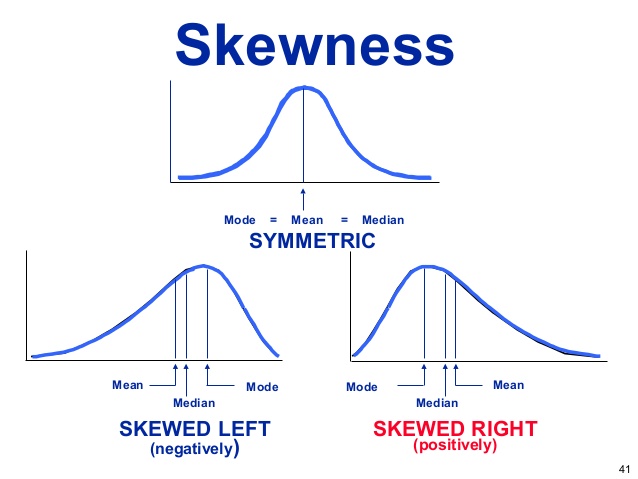
Data is rarely perfectly balanced. Incomes, house prices, and hospital stays often lean heavily in one direction. A few exceptionally high or low values pull the mean away from the central tendency of most observations. Imagine a seesaw with children on one side and an elephant on the other—the average weight no longer tells the truth about the playground.
Analysts studying such distributions quickly realise that depending on the mean is like relying on a compass near a magnet—it points, but not always in the right direction. This is why training modules in a data analyst course in Pune stress the importance of checking data shape before choosing a summary statistic. The shape tells the story, and the median often becomes the narrator that resists distortion.
The Resilience of the Median: Standing Firm Amid Extremes
The median is not interested in every single fluctuation. It only cares about the middle position, dividing data into two equal halves. Outliers may scream for attention, but the median remains silent and immovable. Think of it as a lighthouse in a storm—it continues to guide ships regardless of the waves crashing around it.
This robustness is invaluable when analysing real-world datasets where outliers are inevitable. For example, in healthcare studies, one patient with an exceptionally long hospital stay can distort the mean, giving an exaggerated picture of treatment outcomes. The median, by contrast, reflects the typical patient experience more accurately. Students in a structured data analyst course often work with such skewed datasets to understand why the median tells a clearer, fairer story.
Median in Practice: Beyond Just Numbers
In practical applications, the choice between mean and median can influence life-changing decisions. Governments rely on median income, not mean income, to design welfare schemes. Real estate reports quote median house prices because a single luxury mansion could otherwise inflate the average unrealistically. Even in business intelligence dashboards, the median often paints a truer picture of customer behaviour.
By anchoring itself to the central point, the median captures the “typical” reality, which is often more useful than a mathematically correct but misleading mean. This practical wisdom is something reinforced in advanced sessions of a data analysis course in Pune, where case studies highlight how a poor choice of estimator can misguide strategies and decisions.
Why Analysts Still Teach Both: The Balance of Tools
Despite the median’s robustness, the mean is not without value. In normally distributed datasets, where values cluster symmetrically, the mean provides more nuanced information. It accounts for every data point, making it essential in inferential statistics and regression models. Yet when skewness enters the room, the median proves its worth.
The best analysts learn not to abandon one tool for another but to recognise when each should be applied. This dual awareness is drilled into participants of every good data analyst course, ensuring they approach problems not with bias toward a single method but with flexibility in their toolkit.
Conclusion: The Fair Judge of Skewed Stories
In the grand theatre of data, the mean is like an actor swayed by applause, while the median plays the impartial judge, unmoved by outliers. For skewed datasets, the median shines as the more trustworthy guide, offering clarity where the mean might mislead. Analysts who appreciate this distinction do more than crunch numbers—they uncover truth hidden within imbalance.
The next time a dataset feels tilted, remember the lesson: the median may not shout the loudest, but it often speaks with the most fairness.
Business Name: ExcelR – Data Science, Data Analytics Course Training in Pune
Address: 101 A ,1st Floor, Siddh Icon, Baner Rd, opposite Lane To Royal Enfield Showroom, beside Asian Box Restaurant, Baner, Pune, Maharashtra 411045
Phone Number: 098809 13504
Email Id: enquiry@excelr.com